Microsoft Solver Foundation – Logistical route optimization
Purpose: The purpose of this document is to illustrate how to use Microsoft Solver Foundation in order to resolve Logistical route optimization problem.
Challenge: Logistical route optimization problem is a typical problem in Supply Chain Optimization domain. This problem is especially important in Distribution and Retail environments with Transportation management needs. For example, many companies plan and organize deliveries of goods from distribution centers to stores or directly to customers. Often times these deliveries consist of multiple segments. A natural question is "What would be the most optimal route for the truck if it needs to pass number of points on its way?" Obviously there're many software packages available for logistical route optimization, but there may be a need to implement a very specific requirements or just to do a rough estimation instead of precise calculation. Please find more info about Supply Chain Optimization here: http://en.wikipedia.org/wiki/Supply_chain_optimization
Solution: In this walkthrough we'll utilize the power of Microsoft Excel and Microsoft Solver Foundation in order to resolve Logistical route optimization problem. Speaking mathematical language our objective is to find a least cost logistical route while passing all predefined points on the way. In mathematics this problem is called Travelling Salesman Problem. You can find more info about TSP here: http://en.wikipedia.org/wiki/Travelling_salesman_problem
The mathematical model (integer linear programming formulation) for this task will look like following:

where Cij – transportation cost between points i and j, and

During the course of this walkthrough we'll build mathematical model to resolve the task using Microsoft Solver Foundation Add-in for Excel. And then upon resolution we'll visualize results using Bing Maps in Excel. I also assume that the initial data set for analysis (Transportation loads) can be retrieved from Microsoft Dynamics AX 2012 using Web Services
Please note that for modeling using Microsoft Solver Foundation Add-in in Excel you will not need strong development skills. For mathematical modeling I'll be using very intuitive OML (Optimization Modeling Language). Please find detailed OML reference here: http://msdn.microsoft.com/en-us/library/ff524507(v=vs.93).aspx.
Walkthrough
Before we begin I will install Microsoft Solver Foundation Add-in for Excel

You can download it from Microsoft Solver Foundation product web site here: http://msdn.microsoft.com/en-us/devlabs/hh145003
As a part of this walkthrough we'll also need Bing Maps WPF Control which can be downloaded from here: http://www.microsoft.com/en-us/download/details.aspx?id=27165
Now let's start with formalization of the problem in Excel
Initial representation of the task

Thus our first list of x and y defines geo-coordinates of logistical route stops. Please note that for the sake of simplicity I use the scale from 0 to N
The matrix in upper right corner defines Cij - transportation costs between points i and j. Transportation costs are calculated as simple Euclidean distance using the formula (example)

Please find info about how to calculate Euclidean distance here: http://en.wikipedia.org/wiki/Euclidean_distance
On the left hand side (i) we have Origins and at the top (j) we have Destinations
For the sake of simplicity my matrix is only 10x10, but in general case obviously you may have many more logistical route stops (NxN)
Now let's prepare the data for mathematical modeling and present it as a list
Simplified representation of the task

…
Please note that I just introduced the list underneath
In this list I added SRC and DST numeric fields to represent Origins and Destinations respectively for convenience of math modeling
Now let's start building Microsoft Solver Foundation model
First off we'll introduce appropriate sets to represent from (i) and to (j) points
Sets - SRC

Sets - DST

All is very simple: SRC = Source, DST = Destination
Then we'll add parameters. In particular something given to us is Cij – transportation costs between points i and j
Parameters - COST

This info resides in Excel workbook, that's why we'll bind math model parameter COST to appropriate cells in Excel workbook
Binding Editor - COST

And this is how you specify Table/Range in Binding Editor. Please note how we define Cij: i = SRC, j = DST and value field itself is COST
Excel workbook - COST

COST[SRC, DST] = Cost of shipment/transportation from Source to Destination, for example
The next step is to describe the route. Parameter DEMAND will help us to define where we should start and where we should end our logistical route
Parameters - DEMAND

Binding Editor - DEMAND

Excel workbook - DEMAND

Please note that our Start Node 0 (-1), our End Node 9 (+1), and all other Nodes (0)
This is how we encoded these logical requirements into our model
The next step is to define the decision. For this task our goal is to build number of channels between points i and j - Sources and Destinations – which will comprise our logistical route. That's why we can now define CHANNELS[SRC, DST] as below
Decision - CHANNELS

Similarly we can bind CHANNELS[SRC, DST] to Excel workbook cells which will display the results for us
Binding Editor

Please note that I still use the same selection for Table/Range. This time I just mapped Value field to CHANNELS column
Excel workbook

Please note that CHANNELS[SRC, DST] = 1 in case we will have to go from SRC Origin to DST Destination (by other words, there's a channel between SRC Origin and DST Destination as a part of logistical route), and 0 otherwise. This is done for the convenience of mathematical modeling
We have mapped COST and CHANNELS columns by now which is enough to define the optimization criteria. In fact we want to define CHANNELS[SRC, DST] – channels between Origin and Destination as a part of logistical route in order to MINIMIZE Total Transportation Cost
For this purpose we'll define the goal as below
Goal - TOTALCOST
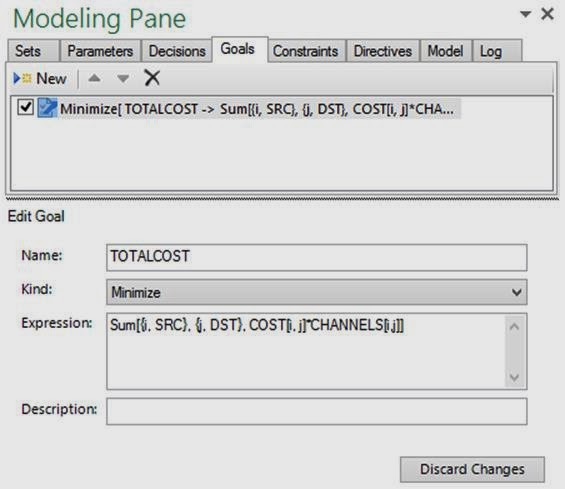
Expression – TOTALCOST
Sum[{i, SRC}, {j, DST}, COST[i, j]*CHANNELS[i,j]]
|
Please note that we calculate TOTALCOST as a sum of COST[SRC, DST] x CHANNELS[SRC, DST] for all pairs of Origin and Destination. Essentially this can be represented with pseudo-code below
Pseudo-code - TOTALCOST
for (i = 0; i < N; i++)
{
for (j=0; j < M; j++)
{
TOTALCOST += COST[i, j] x CHANNELS[i, j];
}
}
|
As you can see OML is a very intuitive, easy to use and laconic language. You should not necessarily be a developer write OML constructs, in fact Business Analysts and Power Users in your organization may be very proficient in OML
Please find OML reference (SUM function) here: http://msdn.microsoft.com/en-us/library/ff818513(v=vs.93).aspx
The goal is to minimize the cost of transportation and still pass all required points on the way
To complete the model we'll need to introduce appropriate constraints
Constraints - ARRIVENODE

Expression - ARRIVENODE
Foreach[{i,SRC},Sum[{j, DST}, CHANNELS[i,j]]>=1]
|
Constraints - REPEATCHANNEL

Expression - REPEATCHANNEL
Foreach[{i,SRC},{j,DST},CHANNELS[i,j]+CHANNELS[j,i]<=1]
|
Constraints - LEAVENODE

Expression - LEAVENODE
Foreach[{z,SRC},Sum[{x,SRC}, CHANNELS[x,z]]-Sum[{y,DST}, CHANNELS[z,y]]==DEMAND[z]]
|
Constraints - NOCHANNEL

Expression - NOCHANNEL
Foreach[{i,SRC}, CHANNELS[i,i]==0]
|
As you can see I defined 4 constraints as following
ARRIVENODE: This constraint requires that each point be arrived at from exactly one other point
REPEATCHANNEL: This constraint prevents repeat of the channel. Specifically, CHANNEL[i,j] and CHANNEL[j,i] are considered to be the same, so we can't have them both at the same time
LEAVENODE: This constraint requires that from each point there is a departure to exactly one other point
NOCHANNEL: This constraint prevents self-channels like CHANNEL[i,i] or CHANNEL[j,j] which is logical
All constraints are very simple and self-explanatory. This set of constraints should be a required minimum to have in order to resolve the task
Let's review the entire model now
Model

OML
Model[
Parameters[
Sets[Any],
SRC,
DST
],
Parameters[
Reals[-Infinity, Infinity],
COST[SRC, DST]
],
Parameters[
Integers[-1, 1],
DEMAND[SRC]
],
Decisions[
Integers[0, 1],
CHANNELS[SRC, DST]
],
Constraints[
ARRIVENODE -> Foreach[{i,SRC},Sum[{j, DST}, CHANNELS[i,j]]>=1],
REPEATCHANNEL -> Foreach[{i,SRC},{j,DST},CHANNELS[i,j]+CHANNELS[j,i]<=1],
LEAVENODE -> Foreach[{z,SRC},Sum[{x,SRC}, CHANNELS[x,z]]-Sum[{y,DST}, CHANNELS[z,y]]==DEMAND[z]],
NOCHANNEL -> Foreach[{i,SRC}, CHANNELS[i,i]==0]
],
Goals[
Minimize[
TOTALCOST -> Annotation[Sum[{i, SRC}, {j, DST}, COST[i, j]*CHANNELS[i,j]], "order", 0]
]
]
]
|
Essentially this model is all you need to resolve Logistical route optimization problem we initially formulated. And this is exactly what we are going to do right now
Log

Log
[11/17/2013 10:05:38 PM] Solve started...
[11/17/2013 10:05:39 PM] Excel: 00:00:00.0864973
[11/17/2013 10:05:41 PM] ===Solver Foundation Service Report===
Date: 11/17/2013 10:05:41 PM
Version: Microsoft Solver Foundation 3.0.2.10889 Express Edition
Model Name: DefaultModel
Capabilities Applied: MILP
Solve Time (ms): 59
Total Time (ms): 221
Solve Completion Status: Optimal
Solver Selected: SolverFoundation.Plugin.Gurobi.GurobiSolver
===Solution Details===
Goals:
TOTALCOST: 121.3
[11/17/2013 10:06:42 PM] Solve Complete
|
When you solve the model you will see the outcome as shown above
Please note that the system provides the solution and details of the algorithm which has been chosen to resolve the task. On the Solver Foundation Results tab you can now see optimal values of CHANNELS[SRC, DST]
Result


Now we can also represent the optimal route visually using simple Excel graph
Excel workbook

Now after we solved the model and got the result we can visualize the result on Bing Maps. For this purpose I built a custom Excel Add-in to embed Bing Maps directly into Excel workbook
Visualization
Our task will be to visually present optimal delivery route on the map using Bing Maps
In this case I decided to create a custom Excel Add-in using Bing Maps WPF Control. The Bing Maps Windows Presentation Foundation (WPF) Control combines the power of Windows Presentation Foundation and Bing Maps to provide an enhanced mapping experience. Please find more info about Bing Maps WPF Control here: http://msdn.microsoft.com/en-us/library/hh750210.aspx
You can also find guidance about using WPF Controls in Office Solutions here: http://msdn.microsoft.com/en-us/library/bb772076.aspx
As the result I also built a custom Ribbon bar to be able to display Bing Maps and draw optimal logistical route
Excel workbook – Add-ins tab

Map button under Bing Maps WPF Control section would display Bing Maps as shown below
Excel workbook – Map button

And Route button under Bing Maps WPF Control section would draw the optimal logistical route as shown below
Excel workbook – Route button

Now let's review how I built a custom Excel Add-in to embed Bing Maps into Excel workbook
First off I created Excel 2013 Add-in project in Visual Studio 2013
Project

After that I installed Bing Maps WPF Control on my machine
Bing Maps WPF Control

After installation of Bing Maps WPF Control you will be able to add it as a reference to the Project
The next immediate step is to add WPF User Control to the Project
WPF User Control

And then we add Map control onto WPF User Control as shown below
Visual Studio Project – Map control

In order to compile the Project successfully we'll need to add several references as shown below
Reference Manager

For example, if you see "The type name 'IComponentConnector' could not be found in the namespace 'System.Windows.Markup'. This type has been forwarded to assembly 'System.Xaml, Version=4.0.0.0, Culture=neutral, PublicKeyToken=ABC' Consider adding a reference to that assembly." complilation error, please don't forget to add System.Xaml as a reference
XAML
<UserControl x:Class="AlexExcelAddIn.AlexUserControl"
xmlns="http://schemas.microsoft.com/winfx/2006/xaml/presentation"
xmlns:x="http://schemas.microsoft.com/winfx/2006/xaml"
xmlns:mc="http://schemas.openxmlformats.org/markup-compatibility/2006"
xmlns:d="http://schemas.microsoft.com/expression/blend/2008"
xmlns:m="clr-namespace:Microsoft.Maps.MapControl.WPF;assembly=Microsoft.Maps.MapControl.WPF"
mc:Ignorable="d"
d:DesignHeight="300" d:DesignWidth="300">
<Grid>
<m:Map/>
</Grid>
</UserControl>
|
WPF User Control

After WPF User Control has been created I will have to wrap it up with User Control as shown below
User Control

User Control

Please note that the reason why I needed to wrap WPF User Control up with User Control element is because of the error during installation of WPF User Control. Please see details below
Imagine that you just want to install WPF User Control as Excel Add-in customization
Microsoft Excel Add-in (Active X)

More Controls - Installation

Microsoft Excel - Error

In order to avoid this error during installation you can wrap WPF User Control up with User Control element as I described above. Please see detailed explanation of this issue in the article on how to Host WPF control in Excel: http://msdn.microsoft.com/en-us/library/bb772076.aspx
When we completed the exercise of creating Map control now we can introduce a Ribbon bar
Ribbon Bar

Ribbon Bar

When building your own custom Excel Add-in you can decide on what icons to use
Map icon

Route icon

As the result the solution will look like this
Solution

Please see source code presented below
AlexUserControl.xaml
<UserControl x:Class="AlexExcelAddIn.AlexUserControl"
xmlns="http://schemas.microsoft.com/winfx/2006/xaml/presentation"
xmlns:x="http://schemas.microsoft.com/winfx/2006/xaml"
xmlns:mc="http://schemas.openxmlformats.org/markup-compatibility/2006"
xmlns:d="http://schemas.microsoft.com/expression/blend/2008"
xmlns:m="clr-namespace:Microsoft.Maps.MapControl.WPF;assembly=Microsoft.Maps.MapControl.WPF"
mc:Ignorable="d"
d:DesignHeight="300" d:DesignWidth="300">
<Grid>
<m:Map Name="myMap" CredentialsProvider="XYZ" Center="47.6424,-122.3219" ZoomLevel="16"/>
</Grid>
</UserControl>
|
Here you will have to provide Bing Maps account credentials. In order to retrieve Bing Maps key please go to https://www.bingmapsportal.com/
UserControl1.cs
using System;
using System.Collections.Generic;
using System.ComponentModel;
using System.Drawing;
using System.Data;
using System.Linq;
using System.Text;
using System.Threading.Tasks;
using System.Windows.Forms;
namespace AlexExcelAddIn
{
public partial class UserControl1 : UserControl
{
public UserControl1()
{
InitializeComponent();
}
public Microsoft.Maps.MapControl.WPF.Map wpf()
{
return alexUserControl1.myMap;
}
}
}
|
Ribbon1.cs
using System;
using System.Collections.Generic;
using System.Linq;
using System.Text;
using Microsoft.Office.Tools.Ribbon;
using Microsoft.Maps.MapControl.WPF;
using Excel = Microsoft.Office.Interop.Excel;
using Microsoft.Office.Tools.Excel;
namespace AlexExcelAddIn
{
public partial class Ribbon1
{
UserControl1 ctrl;
MapPolyline route;
private void Ribbon1_Load(object sender, RibbonUIEventArgs e)
{
ctrl = new UserControl1();
}
private void button1_Click(object sender, RibbonControlEventArgs e)
{
Worksheet worksheet = Globals.Factory.GetVstoObject(Globals.ThisAddIn.Application.ActiveWorkbook.Worksheets[1]);
if (worksheet.Controls.Contains("AlexWPF") == false)
{
worksheet.Controls.AddControl(ctrl, 0, 0, 500, 500, "AlexWPF");
}
}
private void button2_Click(object sender, RibbonControlEventArgs e)
{
Worksheet worksheet = Globals.Factory.GetVstoObject(Globals.ThisAddIn.Application.ActiveWorkbook.Worksheets[1]);
if (worksheet.Controls.Contains("AlexWPF") == true)
{
if (route != null)
{
ctrl.wpf().Children.Remove(route);
route = null;
}
Excel.Range objRange = (Excel.Range) Globals.ThisAddIn.Application.Selection;
int nColCount = objRange.Columns.Count;
int nRowCount = objRange.Rows.Count;
route = new MapPolyline();
route.Stroke = new System.Windows.Media.SolidColorBrush(System.Windows.Media.Colors.Black);
route.StrokeThickness = 5;
route.Opacity = 0.7;
LocationCollection locations = new LocationCollection();
for (int nRowCounter = 1; nRowCounter <= nRowCount; nRowCounter++)
{
//for (int nColCounter = 0; nColCounter < nColCount; nColCounter++)//2 columns
{
locations.Add(new Location(Convert.ToDouble(objRange.Value2[nRowCounter, 1]), Convert.ToDouble(objRange.Value2[nRowCounter, 2])));
}
}
route.Locations = locations;
ctrl.wpf().Children.Add(route);
}
}
}
}
|
Ultimately your Excel Add-in file will be ready for installation
Excel Add-in VSTO

By launching it you will install your customization
Microsoft Office Customization Installer

As the result your Excel Add-in will show up in the list of installed programs
Programs and features

And list of available Excel Add-ins
COM Add-ins

Please note that this is only one of available visualization options. Please review other visualization options below
Bing Maps

Bing Maps allows for various import options in order to build your own visual routes
Bing Maps - My places


Bing Maps – Import to my places

As the result your route may look like this
Bing Maps

Please find more info about Bing Maps API here: http://www.microsoft.com/maps/choose-your-bing-maps-API.aspx
The same Bing Maps WPF Control I initially used can also be used to display Bing Maps inside of Microsoft Dynamics AX 2012. This software development kit (SDK) provides the binaries and programming reference for the Bing Maps Windows Presentation Foundation Control. You can download Bing Maps WPF Control from here: http://www.microsoft.com/en-us/download/details.aspx?id=27165
When you embed Bing Maps into Microsoft Dynamics AX 2012 form this is how you result may look like
Microsoft Dynamics AX 2012 form

Another option for you can be to use one of ISV products. For example, MapCite VSTO Add-in for Excel. You can download MapCite VSTO Add-in from here : http://www.mapcite.com/excel-trial.aspx
Thus you can provide the data for visualization
MapCite - Data

Then define required setup for visualization
MapCite - Setup

And then get the result of shown below
MapCite - Map

Now let's come back to more Map visualization options provided by Microsoft. Using these options you can also get a very precise route optimization (including detailed driving directions, etc.) if required
Next in line is MapPoint product. MapPoint 2013 gives you the power to visualize business data and communicate insights with instant impact. Before you hit the road, plug in your stops and MapPoint plots the most efficient course with turn-by-turn driving directions. Please find more info about Map Point here: http://www.microsoft.com/mappoint/en-us/home.aspx
Map Point

Map Point - Data

This is how Map Point can calculate a precise route and display it on the map
Map Point - Map

Finally you can take advantage of Windows 8 Bing Maps Trip Optimizer which is included into Windows 8 SDK. Please find more info about Windows 8 Bing Maps Trip Optimizer here: http://msdn.microsoft.com/en-us/library/windows/apps/hh699893.aspx
Bing Maps Trip Optimizer - Route

Bing Maps Trip Optimizer – Driving Directions

Please note that using Bing Maps Trip Optimizer you can optimize your route in a very precise way using different criteria such as Minimize distance, Minimize time, Avoid traffic, etc., get real time driving directions and more.
Summary: In this document I illustrated how to use Microsoft Solver Foundation in order to resolve Logistical route optimization problem. In particular in order to resolve this problem I used Microsoft Solver Foundation and Microsoft Excel providing robust platform for solving complex mathematical problems and rich visualization means to analyze the results of optimization. Please note that the data for initial analysis can be extracted from Microsoft Dynamics AX 2012 by means of Web Services, and optimization results can be pushed back to Microsoft Dynamics AX 2012 the same way. For example, input data about Delivery route points can come in form of Transportation load segments. For communication with Microsoft Dynamics AX 2012 you may use standard Microsoft Dynamics AX 2012 Excel Add-in and/or custom Excel Add-ins supported by Web Services. It is also very important to mention that using Microsoft Solver Foundation Add-in for Excel doesn't require strong development skills, thus Business Analysts and Power Users may be very proficient in doing various optimizations using familiar Excel user interface. Please find more info about Modeling in Excel here: http://msdn.microsoft.com/en-us/library/ff524510(v=vs.93).aspx
Note: This document is intended for information purposes only, presented as it is with no warranties from the author. This document may be updated with more content to better outline the concepts and describe the examples.
Tags: Dynamics ERP, Dynamics AX 2012, Logistical Route Optimization, Supply Chain Optimization, Solver Foundation, Excel, Custom Excel Add-in, Bing Maps, Web Services, Distribution, Retail, Transportation Management, Loads, Segments
Author: Alex Anikiev, PhD, MCP